
#datascience #ai #data-driven-product
19. März 2020 |
- min Lesezeit
It all started at the end of February: after observing the international situation regarding Covid-19 I noticed that, although the number of infections was still low, there was a steady increase of new infections in Germany. Now, the big danger with pandemics is the exponential growth, as explained wonderfully in this video. Most of the websites I found though, only provided the update about the current numbers, and therefore I saw the necessity to track these numbers in order to visualize the growth over time.
I chose Google Sheets as a tool to build a prototype as quickly as possible, in line with the agile mindset of DieProduktMacher. Its two fundamental building blocks are:
As a company, we started to check the data regularly, and after one week of observations we could see that in Germany, similarly to other countries, there was a clear exponential trend. This was in the very beginning of March, days away from the social-distancing measures that are now in place.
“
At the end of the 2nd week of March we could realize that by the following week we would hit 10k infections
“
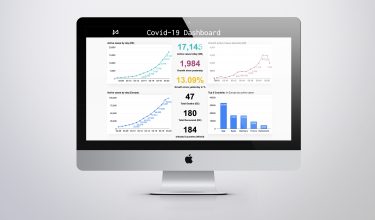
At this point I thought that observing the past was not enough, a forecast was needed, which we added with an underlying exponential model. It didn’t take long, by observing the forecast and the other data, for the dashboard to serve its purpose. At the end of the 2nd week of March we could realize that by the following week we would hit 10k infections in Germany, based on our projections. This number was greatly alarming, since Italy back then was already in a very bad condition with 12k cases. It was not easy, but we made the tough (and right!) decision to close our office and continue working remotely.
We have been observing the development since then and created additional tools, such as a Slack-bot that keeps us informed about the current situation in Germany. In order to contribute to create awareness about the evolution of Covid-19, and to explain why social distancing at this point is very important, we decided to make our dashboard public so that more people in Germany can benefit from the insights it provides. Find here our dashboard. We hope to see that curve flatten soon!
#datascience #ai #data-driven-product

#data #databased #datascience

#digital log #podcast #vodcast

#workshop #remote #remote-working
#productmanagment #remote-working #remote

#datascience #internship #maths

#data #data thinking #data science
#datascience #datathinking #aideate

#data #data science #data thinking

#machine-learning #data #data science